What is Chrome DevTools?
Chrome DevTools is a set of tools built directly into the Google Chrome browser for inspecting, editing, and debugging web pages. It is free, already installed, and it is the same toolkit professional web developers use every day. Think of it as an X-ray and a workshop for any page on the internet — you can see exactly how a page is built and change it in real time.
To understand what DevTools shows you, it helps to know how a web page works. Every page is built from three languages: HTML (the structure and content), CSS (the colors, spacing, and layout), and JavaScript (the behavior and interactivity). Your browser downloads all three, then paints them into the page you see. DevTools lets you look at — and tinker with — each layer.
Three ways to open DevTools
There is no single "open" button — you choose the entry point that fits what you want to do. All three below are official, documented methods.
- 1Press F12. The fastest option. On some laptops you may need Fn + F12. This opens whichever panel you used last.
- 2Press Ctrl + Shift + I (Windows/Linux) or Cmd + Option + I (Mac)`. This also opens the last-used panel — a good habit to build muscle memory.
- 3Right-click anything on a page and choose "Inspect." This opens the Elements panel with the exact item you clicked already selected. It is the most intuitive way in for beginners.
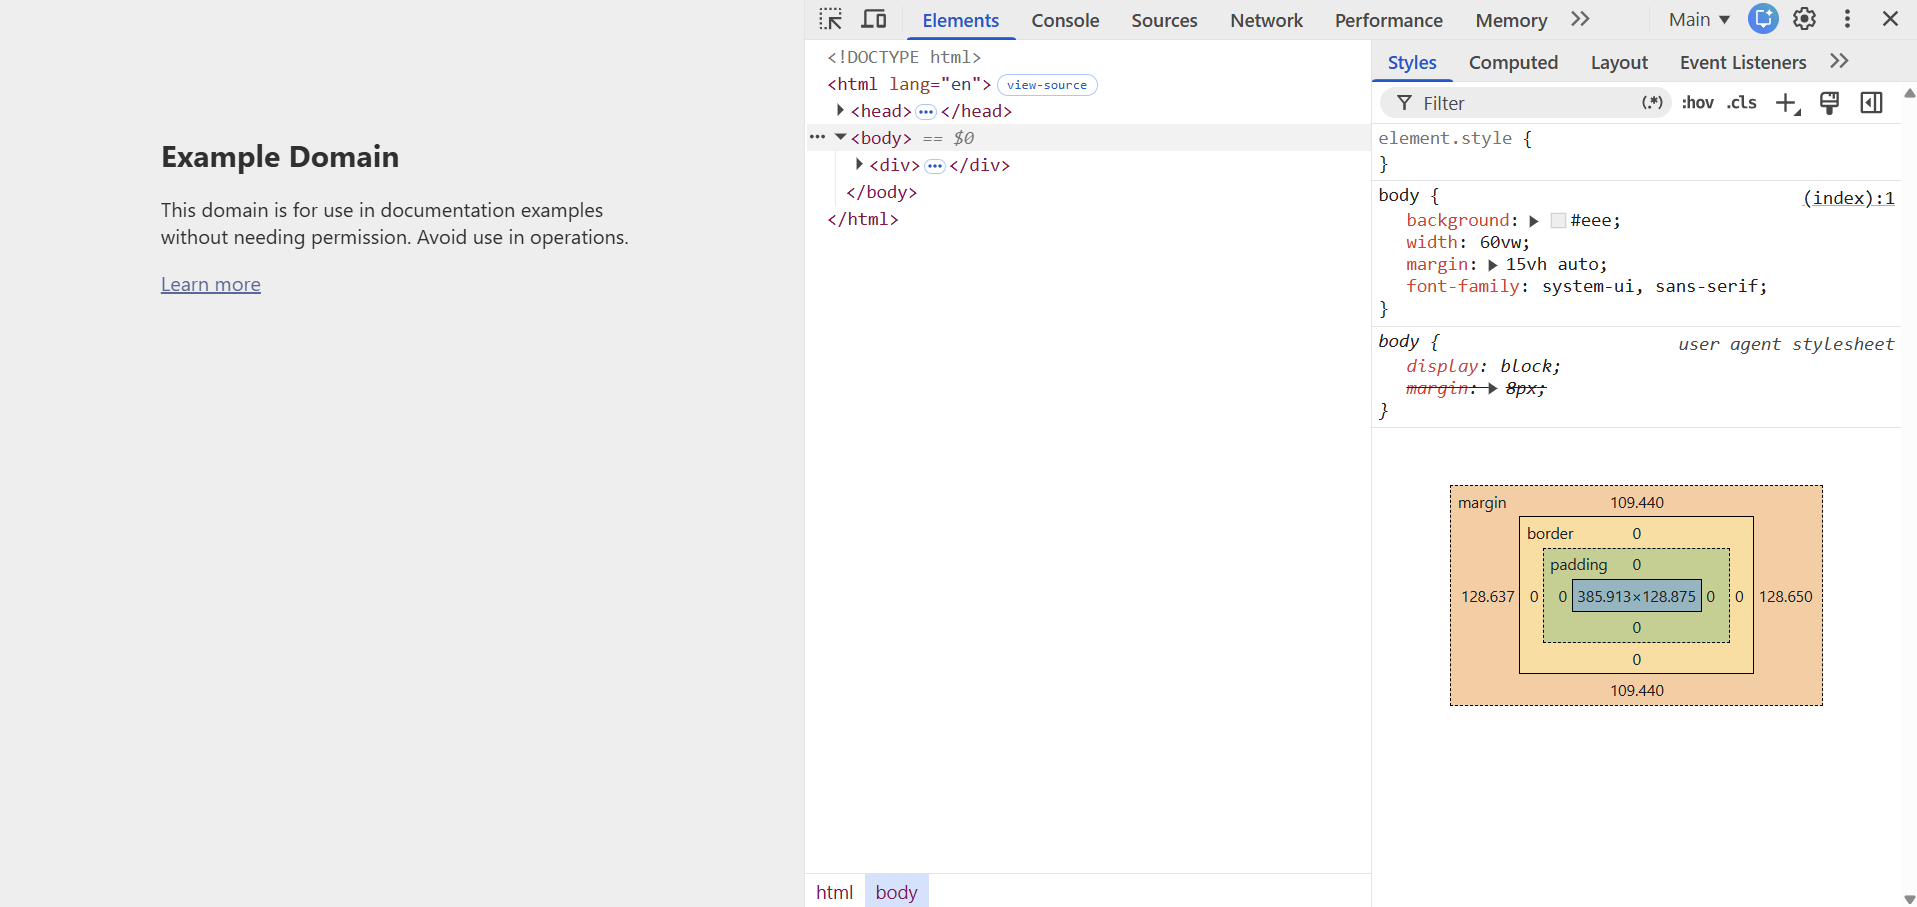
Method 1 — press F12.
The layout: panels, the Drawer, and docking
Once DevTools is open, the row of tabs across the top — Elements, Console, Sources, Network, and more — are called panels. Each panel is a different tool, and this series has a lesson for each one. Do not feel you need to understand them all today; you only need to know they are there.
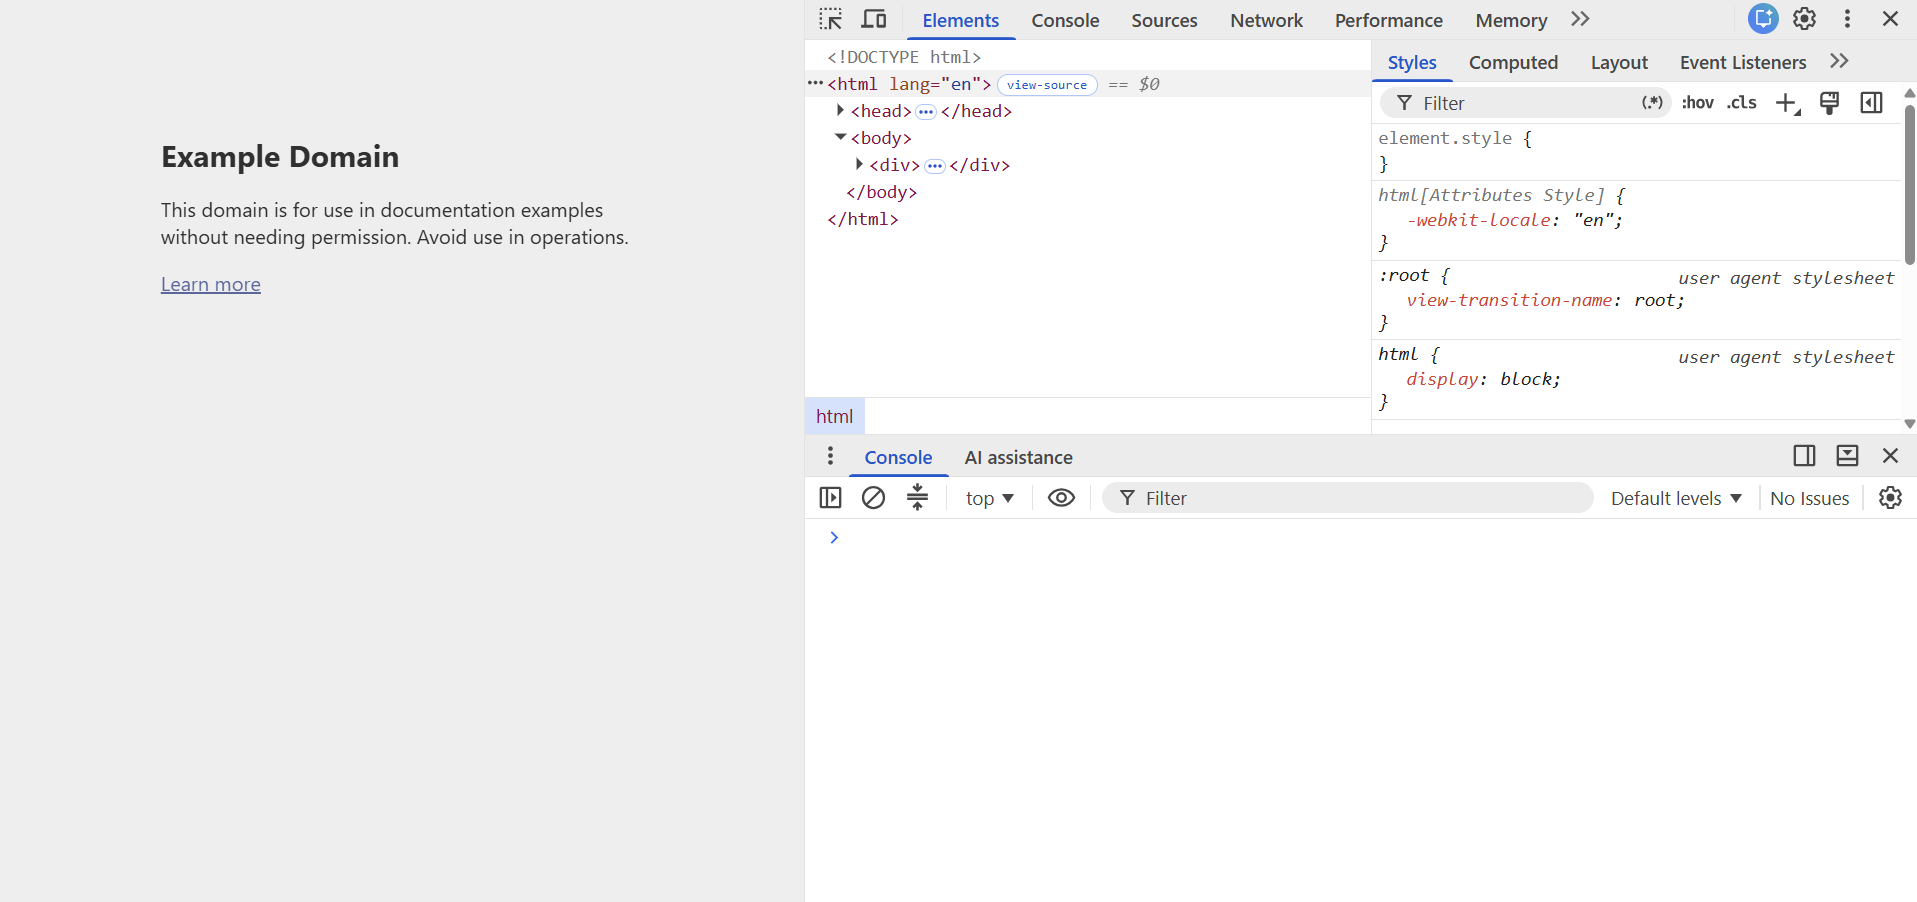
Below the panels is the Drawer, a second row of tools you can show or hide by pressing Esc. It is handy for keeping the Console visible while you work in another panel. You can add more tools to the Drawer from the "More Tools" (⋮) button.
You can also move DevTools to wherever suits you. Using the "Dock side" control (the ⋮ menu, top-right of DevTools), you can dock to the right, dock to the bottom, dock to the left, or undock into a separate window. The keyboard shortcut Ctrl + Shift + D (Cmd + Shift + D on Mac) cycles you back to your last dock position.
The Command Menu: your master shortcut
If you learn one thing today, learn this. The Command Menu is a search box for everything DevTools can do. Open it with Ctrl + Shift + P (Cmd + Shift + P on Mac). Start typing what you want — a panel name, a setting, an action — and press Enter. It was inspired by the command palette in the code editor VS Code, and it means you never have to hunt through menus.
- Run a command: the menu opens with a > prefix. Type an action like "Capture screenshot" or "Disable JavaScript" and run it.
- Open a file: delete the > character and it switches to file search (you can also press Ctrl + P directly).
- See every action: delete the > and type ? to list the available modes.
Settings and themes
Open DevTools settings from the gear icon or by pressing F1. Under Settings › Preferences you will find options for how DevTools looks and behaves. Two are worth setting today: switch the theme between dark and light (or let it match Chrome automatically), and, much later in the series, the Experiments page — where Chrome ships cutting-edge features before they are finished.
Hands-on: your first five minutes
Reading about DevTools teaches you nothing until you open it. Do this now, on any website you like.
- 1Open DevTools three ways in a row: F12, then close it, then Ctrl + Shift + I / Cmd + Option + I, then close it, then right-click something and choose "Inspect."
- 2Dock it three ways: use the ⋮ menu to dock right, then bottom, then into a separate window. Notice which you prefer.
- 3Command Menu: press Ctrl + Shift + P, type "Rendering," and open the Rendering panel.
- 4Theme: open the Command Menu again and run "Switch to light theme" or "Switch to dark theme."
- 5Console peek: click the Console panel, type 1 + 1, and press Enter. DevTools answers 2. You just ran your first line of code inside the browser.
What's next
You can now open DevTools, move it, and reach any tool through the Command Menu. In the next part, we open the Elements panel and do the thing DevTools is most famous for: inspect any page's HTML and edit its CSS live, watching the page change as you type.
Frequently asked questions
- Is Chrome DevTools free?
- Yes. It is built into Google Chrome at no cost, and it is included in other Chromium-based browsers such as Microsoft Edge. There is nothing to install or buy.
- Will editing a page in DevTools change the real website?
- No. Your changes apply only to your own browser and are discarded when you reload the page. The live site and other visitors are unaffected. Later in the series you will learn how to save edits deliberately using Workspaces and Local Overrides.
- What is the difference between F12 and right-click → Inspect?
- F12 opens whichever panel you used last. Right-click → Inspect always opens the Elements panel with the item you clicked already selected — useful when you want to examine one specific thing on the page.
- Do I need to know how to code to use DevTools?
- No. This series starts from zero. You will pick up the small amount of HTML, CSS, and JavaScript you need as you go, one lesson at a time.
This article was produced with AI assistance for research and drafting. All technical steps, keyboard shortcuts, and code samples have been verified against primary Chrome documentation by a human editor.